REmetrics
Track Real Estate
Find out what changes are happening in the housing market
✅ Average price and other metrics
✅ Data updates daily
✅ 187 cities in Canada and the United States
✅ Advanced chart features
This application is an analytics tool for real estate and the housing market.
Offering data, visualization, and metrics to provide information to assist in valuation.

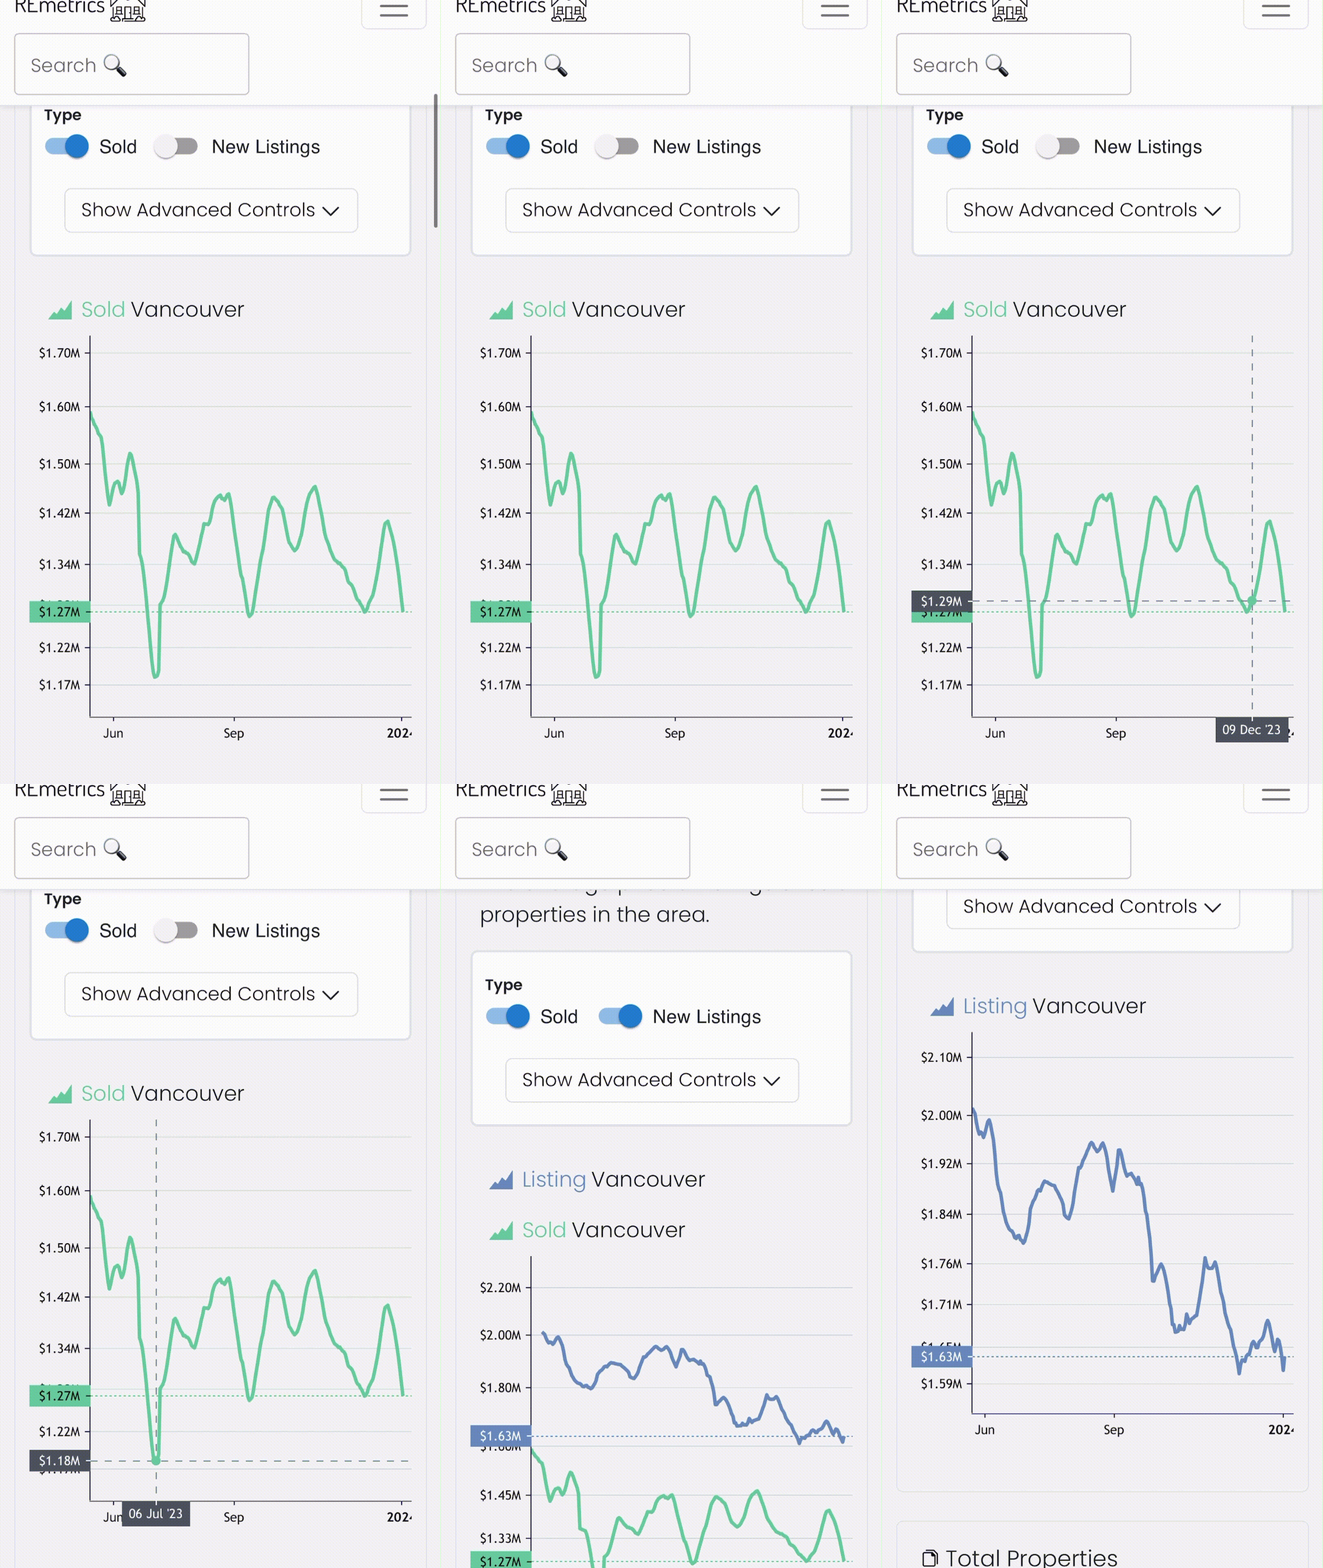
With the metric page you can use the graph toggles to change graph display. Note the graph will display more or less datasets depending on the toggles activated.
The time frame can be adjusted from the dropdown. The scale can be changed from logarthimic to percentage.

There is also a map mode that can be used to interact with the datasets.
Here you can view the locations available, click to view, or compare prices by hovering over each city.
With up-to-date information conscientious investors are able to spot the market's mistakes and make themselves money. At the same time, buying real estate based on intrinsic, long-term trend tracking protects investors from the dangers of short term and anecdotal information.

Real estate analytics and data can help you make informed decisions about buying or selling a property. By analyzing historical sales data, current market trends, and other factors, you can get a better understanding of the value of a property and what you can expect to pay or receive for it. This information can help you negotiate a better price and avoid making costly mistakes.
View each metrics for each locations
